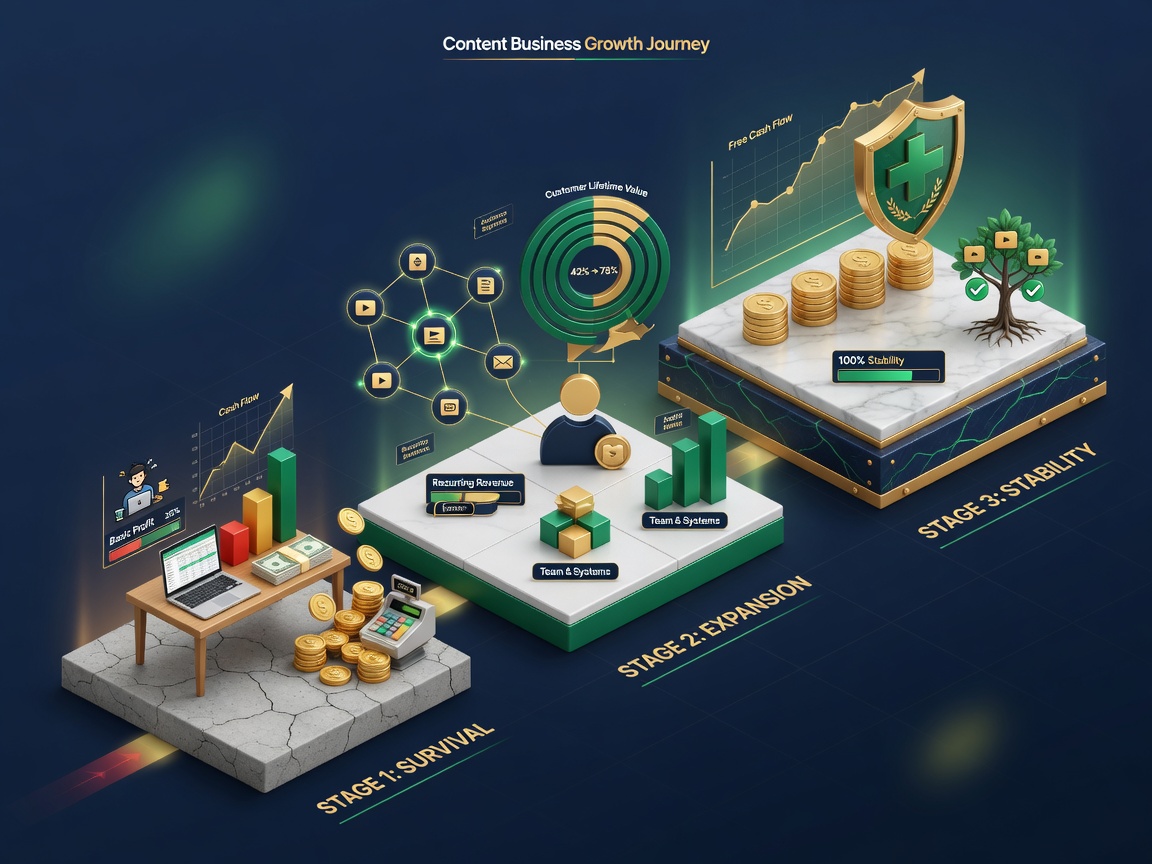
This article breaks down which profit indicators to track for tobacco content entrepreneurship across three stages.
Each stage has different primary indicators: Year 1 survival, Year 3 structural profit thickness, Year 5 profit quality and risk resilience.
Tobacco Content Entrepreneurship: Profit Indicators and Core KPIs for Year 1, Year 3, and Year 5
When starting a tobacco-related content business, many people focus on follower count in Year 1, are still focusing on follower count in Year 3, and only realize by Year 5 that the money in their account and the platform's view counts are almost never on the same curve.
In March 2023, at a content studio near an e-cigarette supply chain in Bao'an, Shenzhen, I helped a team with their accounting. They had 180,000 followers on Douyin with decent monthly views, but when we broke down the profit: content production outsourcing cost 28,000 RMB/month, influencer commissions and samples 16,000, editing and operations staff 32,000, ad testing 12,000 — that month's total revenue from product promotions and consulting was about 94,000 RMB, with gross profit under 6,000. The boss asked me: "Should we go for another viral hit?" I said: "What you should be tracking isn't viral hits — it's the cash recovery speed per effective piece of content."
Tobacco, new tobacco, and smoking cessation content categories have a hard constraint: tight compliance boundaries, strict platform review, and frequent traffic restrictions on public-domain ad placements. Since 2019, China has progressively tightened online advertising and sales of e-cigarettes, with stricter enforcement after 2022; content-driven businesses cannot take the hard-sell product push shortcut and must rely more on education, scenarios, trust, and offline/private-domain conversion. This means: profit indicators cannot simply copy the "hit an ad ROI of 3 then scale" approach from beauty or digital products — you must change primary indicators by stage.
Below, organized by Year 1, Year 3, and Year 5, is what I would actually write in my weekly operating reports.
Part 1: Year 1 — Survive: Track "Cash, Unit Economics, Reusable Content Assets"
1. The Truth About This Stage
The biggest risk in Year 1 is not "not creating a viral hit" — it is thinking traffic equals revenue.
In the second half of 2022, I saw an account focused on heated tobacco popular science in Dongguan. Within 3 months, it spent about 470,000 RMB on information-flow ads, acquired 8,200 leads (WeCom additions), closed about 190 orders at an average of 268 RMB per order. The surface ROI looked terrible: revenue about 50,000, ad spend 470,000. The team argued about creative quality. The real problem was: customer acquisition cost (CAC) had reached 57 RMB per person, with first-order gross profit of only about 80 RMB — before even accounting for content production and after-sales, the unit economics were negative from day one.
In Year 1, be clear about your goal:
- Not "reach 100,000 followers"
- But "find at least one repeatable revenue path with positive contribution margin on that single path"
2. Year 1 Core Profit Indicators
| Indicator | Why It Matters | Suggested Metric Direction |
|---|---|---|
| ----------- | --------------- | --------------------------- |
| Operating Cash Flow (Monthly) | Your account can go viral, but your company can die on rent and salaries | 3 consecutive months of narrowing net cash outflow; at minimum know "how many months we can survive" |
| Contribution Margin | After removing direct variable costs, how much is left to support the team | Single-channel contribution margin >= 0, then talk about scaling |
| CAC (Customer Acquisition Cost) | Tobacco categories have long conversion funnels where CAC easily spirals | Separate private-domain add-friend cost and valid inquiry cost |
| First-Order Gross Margin | Many product promotions are actually loss-leading | First-order gross margin should ideally be >= 30%, otherwise must rely on repeat purchases |
| Content Marginal Cost | How much each additional piece of content costs | After template-based scripting, per-piece production cost should drop 30% to 50% |
| Effective Conversion Rate | Views, private messages, WeCom, in-store visits — which step breaks | Closer to money than completion rate |
3. Year 1 Core KPIs
- Monthly net operating cash flow
- Per-content customer acquisition cost
- Lead-to-deal conversion rate
- Average first-order contribution margin
- Content reuse rate
- Compliance block rate (this is a hidden profit killer)
4. Operations and Pitfalls I Personally Experienced (April-September 2023)
- April: Stopped all trending topic challenges, kept only 3 content types — quitting motivation, oral/respiratory sensation comparisons, product usage misconceptions.
- May: Changed conversion path to "content -> keyword in comments -> WeCom -> manual diagnostic communication within 48 hours -> in-store/delivery".
- June: Introduced a tracking table: record production cost, views, follows, transactions, and returns per video.
- July: Cut all ad placements with negative contribution margin; put 70% of budget on proven scripts.
- September: Monthly net cash outflow narrowed from about -62,000 to -11,000.
Specific problems:
- Platform review: Titles with phrases like "quit smoking miracle tool" or "cigarette replacement" were repeatedly flagged as borderline, causing entire weeks of traffic to be cut in half.
- Sample costs spiraled: At one point we sent 120 sample sets monthly, with fewer than 8% following up to purchase.
- Treating followers as assets: Of 180,000 followers, fewer than 4% entered private domain with interaction in 90 days. Followers are not a profit indicator; reachable users are.
Year 1 personal view: The core of profit indicators is stopping losses and validation, not optimization to perfection.
Part 2: Year 3 — Build Thickness: Track "Repeat Purchases, Structural Profit, Per-Capita Efficiency"
1. Stage Transition Signals
By Year 3, you typically have:
- A relatively stable content production line
- 1-2 product/service combinations that consistently generate orders
- Initial private domain (WeCom/community/membership)
If you still use "view count YoY growth" as your primary KPI, your team will fall into ineffective busyness. The profit paradox in Year 3: revenue is growing, but profit margin is not; headcount is growing, but per-capita output is not.
2. Year 3 Core Profit Indicators
| Indicator | Meaning | Why It Becomes Primary in Year 3 |
|---|---|---|
| ----------- | --------- | ---------------------------------- |
| Gross Margin | Revenue minus cost of sales | Start discussing whether we are making money |
| Repeat Purchase Rate / Frequency | Whether old customers return | In later-stage content businesses, most profit hides in returning customers |
| LTV (Customer Lifetime Value) | A customer's long-term contribution | Used to determine the maximum CAC you can afford |
| LTV / CAC | Long-term health | Rule of thumb: at least > 3 before aggressive ad spend |
| Per-Capita Efficiency | Gross profit / full-time employees | Prevents "adding people to grow" |
| Return Rate and Complaint Cost | Hidden profit leakage | Tobacco-related products are extremely reputation-sensitive |
| Private-Domain Revenue Share | Dependence on public-domain algorithms | When this share rises, profit volatility drops |
3. Year 3 Core KPIs
- Overall gross margin
- 90-day repeat purchase rate
- Returning customer revenue share (aim for 40%+)
- LTV / CAC
- Per-capita contribution margin (monthly)
- Private-domain GMV share and private-domain conversion cost
- Content-to-purchase average decision cycle (shorter cycle = faster cash turnover)
4. A Real Structural Adjustment (2024, South China Team)
In February 2024, a content team focused on adult harm-reduction education plus device peripherals asked me for a review. Their annual revenue was about 6.8 million RMB, but net profit margin was under 4%. The problem was structure:
- Viral hits drove low-margin distribution products (gross margin 18% to 22%)
- High-margin in-house consumables (55%+ gross margin) were not featured in content or sold in bundles
- Community of 23,000 had less than 8% monthly activity, basically an announcement group
Three changes:
- Changed content KPI from view count to "high-margin SKU content share": out of 12 weekly pieces, at least 5 had to serve products with gross margin over 45%.
- Built automated repeat-purchase mechanism: automatic touchpoints on days 7/21/45 after first purchase.
- Per-capita efficiency reform: replaced "each person must post 2 pieces per day" with "each piece's 14-day contribution margin."
By November 2024:
- 90-day repeat purchase rate: 11% to 19%
- Gross margin: 27% to 36%
- Net profit margin: about 9%
- Private-domain revenue share: 23% to 41%
Year 3 personal view: The essence of profit indicators at this stage is structural optimization.
Part 3: Year 5 — Stability: Track "Free Cash Flow, Profit Quality, Risk Resilience"
1. What to Really Fear in Year 5
By Year 5, the team is often sizable: multiple platforms, multiple SKUs, maybe offline stores, maybe distributors. Revenue looks good, but the boss sleeps poorly because:
- A platform rule change can cut public-domain traffic in half
- A policy shift can invalidate vast content libraries
- A key creator leaving can collapse production
- Book profits exist, but cash is eaten by inventory and receivables
2. Year 5 Core Profit Indicators
| Indicator | Definition/Focus | Decision Purpose |
|---|---|---|
| ----------- | ----------------- | ------------------ |
| Free Cash Flow (FCF) | Operating cash flow minus necessary capex | Can we pay dividends, expand products, withstand cycles |
| Net Profit Margin x Cash Content of Profit | How much net profit becomes real cash | Prevents "making profit without money" |
| Recurring Revenue Share | Memberships, subscriptions, auto-replenishment of consumables | Foundation of valuation and resilience |
| Inventory Turnover and Obsolete Ratio | Especially for in-house hardware/consumables | Hardware easily turns profit into sleeping inventory |
| Single-Platform Revenue Dependency | Largest platform revenue / total revenue | Warn if > 60% |
| Compliance Reserve Tie-up | Removals, recalls, litigation, PR | This is a real profit deduction |
| Organizational Leverage | Whether executives and key talent are tied to long-term profit | Prevents short-term KPI window-dressing |
3. Year 5 Core KPIs
- Quarterly free cash flow
- Net profit margin (and check operating cash flow / net profit ratio)
- Recurring revenue share (target 30% to 50%)
- Largest single-platform revenue share
- Inventory turnover days / obsolete inventory ratio
- Key position backup rate
- Brand premium capability
4. Using a Set of Calm Numbers in Year 5
Suppose you achieve 30 million RMB annual revenue:
- 10% net profit margin -> 3 million net profit
- If receivables and inventory eat 4 million in cash, you are still stressed
- If recurring revenue is only 8%, you must re-fight all battles next year
- If one major platform accounts for 75% of revenue, algorithm change rewrites your profit model
In early 2025, I helped a team entering their fifth fiscal year prepare board materials with a single profit quality table:
- Revenue: 28.4 million
- Net profit: 2.62 million (9.2% net margin)
- Operating cash flow: 1.97 million (profit cash content about 75%, low)
- Cause: distributor payment terms extended from 30 to 60 days, inventory buildup increased about 1.8 million
- Actions: shrink low-credit channels, consumables switched to prepay + auto-replenishment, increase education-to-private-domain-to-pre-sale content ratio
Two quarters later, profit cash content returned to about 95%, net margin dropped only 0.6 points.
Year 5 personal view: At this stage, pursue predictable profit, not exciting profit.
Part 4: Three Stage Comparison Tables
1. Profit Indicator Center of Gravity Shift
| Stage | First Question | Primary Profit Indicators | Can Temporarily Ignore |
|---|---|---|---|
| ------- | --------------- | -------------------------- | ---------------------- |
| Year 1 | Can we run with positive gross margin? | Cash flow, contribution margin, CAC, first-order margin | Brand awareness, perfect org structure |
| Year 3 | Can we retain more profit from same revenue? | Gross margin, repeat purchase, LTV/CAC, per-capita efficiency | Pure follower growth |
| Year 5 | Is profit real cash and sustainable? | FCF, profit cash content, recurring revenue share, dependency | Short-term viral rankings |
2. Core KPI One-Pager
Year 1 KPIs: Cash runway, Per-content CAC, Lead conversion rate, First-order contribution margin, Content reuse rate, Compliance block rate
Year 3 KPIs: Gross margin, 90-day repeat purchase rate, Returning customer revenue share, LTV/CAC, Per-capita contribution margin, Private-domain revenue share
Year 5 KPIs: Free cash flow, Net profit margin x cash content, Recurring revenue share, Single-platform dependency, Inventory turnover, Key backup rate
3. Indicator Usage Discipline
- No more than 5 primary indicators.
- Each indicator must have an owner, calculation methodology, and review frequency.
- Forbidden to use GMV to replace gross margin when discussing performance.
- Compliance costs are real costs — do not calculate profit and then mention in passing that you got banned.
- Do not use next stage's indicators to assess current stage's team.
Part 5: Three Hard Recommendations
1. Know Which Profit Layer You Are Selling
4 monetization layers with completely different profit models:
- Pure content advertising/sponsorship — CPM-based, high client concentration risk
- Distribution/product promotion — commission rate and returns, volume without profit
- Own products (especially consumables) — gross margin and repeat purchase, one of the best long-term structures
- Services/in-store/courses/memberships — delivery cost and renewal, better cash flow
2. If Unit Economics Are Not Clear, Do Not Talk About Scale
A minimum formula (calculate monthly):
- CAC
- First-order contribution margin
- Average repeat purchase frequency (or annual)
- LTV = annual contribution margin x expected years (discount, do not be too optimistic)
- Only if LTV clearly covers CAC and content fixed cost amortization should you increase ad spend
A common counterexample: spend 10,000 on ads, generate 20,000 in sales with 20% gross margin, gross profit 4,000. ROI by sales looks like 2; by gross profit it is a deep loss.
3. Policy and Platforms Are the First Cost Outside the Profit Statement
E-cigarettes and similar categories face long-term restricted marketing space on social platforms. For entrepreneurs:
- Material becomes ineffective quickly -> content asset depreciation should enter your mental accounting
- Review uncertainty is high -> do not annualize a single month's viral profit
- Educational nature is strong -> short-term conversion is low, but once trust is built, repeat purchases and referrals are more valuable
My view: In this track, compliance is not a PR slogan — it is part of gross margin.
Part 6: Stage Decision Checklist
If you are in Year 1: Do three things this week — calculate how long your cash lasts; find one content path with positive contribution margin; purge non-compliant language from your content library.
If you are in Year 3: Open your backend, calculate returning customer revenue share and 90-day repeat purchase rate.
If you are in Year 5: Have your finance team produce a Profit-Cash-Dependency triple table.
Part 7: My Final Judgment
Profit indicators for tobacco content entrepreneurship are a survival strategy:
- Year 1: Use contribution margin and cash to prove content can be exchanged for money without losing it all.
- Year 3: Use repeat purchase, gross margin, and per-capita efficiency to prove money can be retained and replicated.
- Year 5: Use free cash flow and profit quality to prove retained money can withstand rule changes.
If you remember only one sentence: Followers are process data, gross profit is stage data, and cash flow is the verdict.